2075 BHADRA
Old Question Solution (2075 Bhadra)
1. Some people say, 'Information is always costlier than hardware'. Do you agree or disagree? in any case justify your argument, providing some relevant examples too.
Answer:
The assertion that "Information is always costlier than hardware" captures the dynamics between the costs associated with information and hardware. The following topics contribute to the agreement that information is costlier than hardware
- Rapid Evolution of Information Technologies:
The landscape of information technologies is marked by rapid evolution and continuous innovation. The need for organizations to stay at the forefront of technological advancements, coupled with the necessity for specialized skills to manage and extract value from data, contributes significantly to the cost of information. Investments in training personnel, implementing sophisticated data analytics tools, and ensuring compliance with evolving data security standards all constitute substantial financial commitments. For example: Let us consider the realm of big data analytics, where organizations harness vast datasets to derive actionable insights. Implementing and maintaining robust big data analytics platforms, such as Hadoop or Spark clusters, requires substantial financial investments in both hardware infrastructure and skilled professionals capable of optimizing and extracting value from these platforms. The costs associated with acquiring, managing, and analyzing large volumes of data contribute significantly to the overall expenses in such scenarios.
- Cloud Computing Considerations:
While cloud computing has undeniably revolutionized how businesses handle information, it is crucial to recognize that the costs associated with cloud services extend beyond hardware alone. Cloud platforms, exemplified by Amazon Web Services (AWS) and Microsoft Azure, provide scalable solutions but also introduce subscription-based pricing models. The expenditure on cloud services, especially as data storage needs grow, can become a significant component of the overall cost of managing information. For example: Organizations relying on cloud services for data storage, processing, and analysis often face recurring subscription costs. As the volume of stored data increases or the demand for processing power grows, these subscription fees can escalate. While the cloud eliminates the need for substantial upfront hardware investments, the ongoing operational costs associated with managing information in the cloud must be considered in the broader financial context.
- Strategic Importance of Information:
In the contemporary business landscape, the strategic importance of information cannot be overstated. Organizations across various industries are increasingly leveraging data-driven decision-making to gain a competitive edge. The integration of artificial intelligence (AI) and machine learning (ML) into business processes necessitates sophisticated algorithms and specialized expertise, contributing to the overall costs associated with managing and utilizing information effectively. While hardware costs remain significant, the rapid evolution of information technologies, cybersecurity considerations, and the strategic importance of data-driven decision-making contribute to the overall expenses associated with information.
2. What do you mean by extended validation? How can you recognize websites using EV and SSL certificates?
Answer:
Extended validation is a certificate used for HTTPS websites and software that proves the legal entity controlling the websites or software package. To obtain an EV certificate, verification of the requesting entity’s identifier is required by a certificate authority. It increases security due to the identity validation process, which is indicated within the certificate by the policy identifier.
SSL, which stands for Secure Socket Layer, is a standard security technology utilized to establish an encrypted link between a web server and a browser. This encryption ensures the confidentiality and integrity of data transmitted between the two, making it a crucial component for secure online communication.
To establish an SSL connection, a web server requires an SSL certificate. These certificates are small data files that digitally bind a cryptographic key to an organization's details. When installed on a web server, an SSL certificate activates the padlock icon and the "https://" protocol in the website's URL, signifying a secure connection.SSL certificates serve various purposes, including securing credit card transactions, protecting data transfers, and ensuring the privacy of logins. They come in different types, such as Organization Validation (OV), Domain Validation (DV), and Extended Validation (EV), each involving varying levels of examination and validation processes.
Extended Validation (EV) SSL certificates, in particular, raise the bar by incorporating some of the highest standards in identity assurance. The validation process involves a meticulous examination of an organization's legal, physical, and operational existence, as well as verification of domain ownership. Recognizing websites with EV SSL certificates involves checking for distinctive visual cues, such as a green address bar, padlock icon, and the "https://" protocol, indicating a secure and rigorously validated connection.
In essence, the presence of an EV SSL certificate provides users with confidence in the legitimacy of a website, distinguishing it from potential phishing sites and fostering trust in online transactions.
3. What are typical characteristics that a systems designer has to look for in any Enterprise management system? Write in detail the three different system references of ERP, SCM, and CRM.
Answer:
The typical characteristics that a system designer has to look for in any Enterprise management system are listed below:
- Flexible design
- Efficient
- Complete and Accurate
- Integratable
- Continuous improvement
- End-to-end insights
- Integrate risk management and secure compliance
- Continuous monitoring and analysis
Enterprise Resource Planning (ERP), Supply Chain Management (SCM), and Customer Relationship Management (CRM) are three distinct but interconnected systems used in businesses to optimize various aspects of operations. Here's a detailed explanation of each:
1. Enterprise Resource Planning (ERP):
Enterprise Resource Planning (ERP) is a comprehensive software system that integrates key business processes across various departments and functions within an organization. The primary purpose of ERP is to streamline processes, enhance collaboration, and provide a centralized platform for managing critical business data.
ERP core components support the important internal activities of the organization for producing their products and services. These components support internal operations such as the following:
- Financial Management: Components to support accounting, financial reporting, performance management, and corporate governance.
- Operations Management: Components to simplify, standardize, and automate business processes related to inbound and outbound logistics, product development, manufacturing, and sales and services.
- Human Resource Management: Components to support employee recruitment, assignment tracking, performance reviews, payroll, and regulatory requirements.
The advantages of ERP are given below:
- Improved service quality
- Improved productivity
- Strengthening customer relationships
- Improving competitive advantage
- Improving data timeliness and accuracy
2. Supply Chain Management (SCM):
Supply Chain Management (SCM) encompasses the planning, execution, and optimization of all activities involved in the sourcing, procurement, production, and logistics of goods and services. SCM systems aim to ensure the smooth flow of materials, information, and finances from suppliers to manufacturers to retailers to end customers. An SCM system includes more than simply hardware and software, it also integrates business processes and supply chain partners.
ERP systems are primarily used to optimize business processes within the organization, whereas SCM is used to improve business processes that span organizational boundaries. Whereas some stand-alone SCM systems only automate the logistics aspects of the supply chain, organizations can reap greater benefits when the SCM system is tightly integrated with ERP and CRM modules.
Supply Chain Planning involves the development of various resource plans to support the efficient and efficient production of goods and services. Four key processes are generally supported by SCP modules:
- Demand Planning and Forecasting
- Distribution Planning
- Production Scheduling
- Inventory and Safety Stock Planning
3. Customer Relationship Management (CRM):
Customer Relationship Management (CRM) focuses on managing interactions and relationships with existing and potential customers. CRM systems help businesses organize, automate, and synchronize sales, marketing, customer service, and support activities to improve customer satisfaction and loyalty.
A comprehensive CRM system comprises three primary components:
- Operational CRM: Systems for automating the fundamental business processes- marketing, sales, and support for interacting with the customer.
- Analytical CRM: Systems for analyzing customer behavior and perceptions to provide business intelligence.
- Collaborative CRM: Systems for providing effective and efficient communication with the customer from the entire organization.
The benefits offered by CRM are listed below:
- Enables 24/7/365 operation
- Individualized service
- Improved information
- Speeds problem identification/resolution
- Speeds processes
- Improved integration
- Improved product development
- Improved planning
In summary, ERP focuses on integrating core business processes, SCM on optimizing the supply chain, and CRM on managing customer relationships. While they serve different functions, these systems often overlap and complement each other, contributing to the overall efficiency and success of an organization.
4. What do you mean by data mining? How is it related to data warehouses? Differentiate OLAP and OLTP
Answer:
Data mining is the process of sorting through large data sets to identify patterns and relationships that can help solve business problems through data analysis. Data mining techniques and tools help enterprises to predict future trends and make more informed business decisions. Data mining uses statistics, artificial intelligence, machine learning systems, and some databases to find hidden patterns in the data. It supports business-related queries that are time-consuming to resolve.
Data warehousing is a method of organizing and compiling data into one database, whereas data mining deals with fetching important data from databases. Data mining attempts to depict meaningful patterns through a dependency on the data that is compiled in the data warehouse.
Data mining and data warehouses are closely intertwined components in the realm of data analysis. Data warehouses serve as the primary data source for data mining activities, consolidating data from various organizational sources into a unified repository. Data preprocessing tasks, such as cleaning, transformation, and integration, are commonly performed within the data warehouse environment to ensure data quality and suitability for analysis.
The difference between OLAP and OLTP is given as follows:
|
Basis |
OLAP (online analytical processing) |
OLTP (online transaction processing) |
|
Purpose |
OLAP helps you analyze large volumes of data to support decision-making. |
OLTP helps you manage and process real-time transactions. |
|
Data source |
OLAP uses historical and aggregated data from multiple sources. |
OLTP uses real-time and transactional data from a single source. |
|
Data structure |
OLAP uses multidimensional (cubes) or relational databases. |
OLTP uses relational databases. |
|
Data model |
OLAP uses star schema, snowflake schema, or other analytical models. |
OLTP uses normalized or denormalized models. |
|
Volume of data |
OLAP has large storage requirements. Terabytes (TB) and petabytes (PB). |
OLTP has comparatively smaller storage requirements. Gigabytes (GB). |
|
Response time |
OLAP has longer response times, typically in seconds or minutes. |
OLTP has shorter response times, typically in milliseconds |
|
Example applications |
OLAP is good for analyzing trends, predicting customer behavior, and identifying profitability. |
OLTP is good for processing payments, customer data management, and order processing. |
5. The famous bank in town, Chuchche Bank, has DSS built onto the FMS, which automatically estimates the cash amount required for the next day to get from the central treasury for every bank branch, during the end-of-day processing. Present the design and DFDs of such DDS in detail. Clearly state the assumptions you will make on the availability of data and other constraints, first.
Assumptions and Constraints:
Data Availability: Assuming historical transaction data is available for each branch, including cash withdrawals, deposits, ATM transactions, and other relevant activities. Additionally, demographic and economic data for the branch's service area is also accessible.
Constraints: Real-time transaction data might not be immediately available due to processing delays. External factors like holidays or special events might require manual adjustments.
System Design:
Data Extraction: The system extracts relevant data from the Financial Management System (FMS) and external sources at the end of each day. This may include:
- Transaction data (amounts, types) for each branch.
- Branch location and service area demographics.
- Local economic indicators (e.g., average spending, payroll cycles).
- Holiday calendars and event schedules.
Data Preprocessing: The extracted data is cleaned, formatted, and transformed for analysis. This may involve:
- Identifying and handling missing values.
- Aggregating data by branch, category, or time period.
- Normalizing or scaling numerical data.
Cash Forecasting Model: The system employs a statistical forecasting model to predict the cash demand for each branch the next day. Examples include:
- Time series analysis (e.g., ARIMA, SARIMA) to capture historical trends and seasonality.
- Regression analysis to incorporate external factors like holidays and local events.
- Machine learning models trained on historical data and external variables.
Output and Visualization: The system generates reports and visualizations based on the forecast results. This may include:
- Predicted cash needs for each branch.
- Confidence intervals or error bars associated with the predictions.
- Visualizations like charts and graphs for easy interpretation.
- Alerts or flags for branches with unexpectedly high or low predicted demand.
Manual Adjustments: Users can review the forecasts and make manual adjustments based on their expertise and knowledge of local factors.
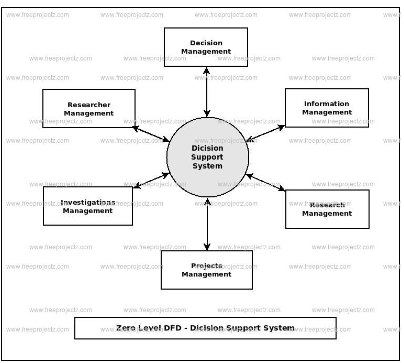
Level 0 DFD:
Context: The entire cash forecasting system.
Inputs: Historical transaction data, branch information, external data sources.
Outputs: Daily cash forecast reports, visualizations, alerts.
Processes: Data extraction, preprocessing, forecasting, visualization, manual adjustments.
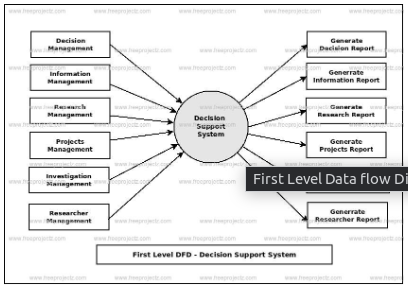
Level 1 DFDs:
Data Extraction: Shows how data is extracted from specific sources (FMS, databases, APIs).
Preprocessing: Illustrates data cleaning, formatting, and transformation steps.
Forecasting: Depicts the chosen model and its inputs/outputs (data, predictions).
Visualization: Demonstrates how forecasts are formatted and presented visually.
Level 2 DFDs:
Data Extraction Level 2 DFD:
Extract Transaction Data:
- Inputs: FMS database table structure, date range selection.
- Outputs: Transaction data (amounts, types, timestamps) for each branch.
- Processes:
- Connect to FMS database.
- Identify relevant tables and fields (e.g., withdrawals, deposits, ATM transactions).
- Filter data based on specified date range (e.g., previous day).
- Extract and format data.
Extract External Data:
- Inputs: External data sources (APIs, databases) specifications.
- Outputs: Demographics, economic indicators, event schedules.
- Processes:
- Connect to external sources (e.g., weather API, government websites).
- Identify relevant data points (e.g., average spending, holidays).
- Extract and format data.
Preprocessing Level 2 DFD:
Handle Missing Values:
- Inputs: Extracted data with missing values.
- Outputs: Data with missing values filled or removed.
- Processes:
- Identify missing value patterns and types.
- Impute missing values using techniques like mean/median imputation or data interpolation.
- Alternatively, remove rows with missing values if appropriate.
Aggregate Data:
- Inputs: Preprocessed data.
- Outputs: Aggregated data by branch, category, or timeframe.
- Processes:
- Group data by chosen criteria (e.g., branch, transaction type, daily/weekly).
- Calculate aggregations like sum, average, or standard deviation.
Normalize/Scale Data:
- Inputs: Aggregated data with varying scales.
- Outputs: Data with normalized or scaled values.
- Processes:
- Identify features with different scales (e.g., transaction amounts vs. population density).
- Apply techniques like min-max scaling or z-score standardization.
Forecasting Level 2 DFD:
Model Selection:
- Inputs: Available forecasting models (e.g., ARIMA, SARIMA, machine learning).
- Outputs: Selected forecasting model based on criteria.
- Processes:
- Evaluate model performance on historical data using metrics like Mean Squared Error (MSE).
- Consider factors like time series seasonality, external variables, and computational complexity.
- Choose the model with the best trade-off between accuracy and feasibility.
Model Training:
- Inputs: Chosen model, preprocessed data.
- Outputs: Trained forecasting model.
- Processes:
- Split data into training and testing sets.
- Train the model on the training data, adjusting hyperparameters (e.g., ARIMA order).
- Evaluate model performance on the testing set.
Prediction Generation:
- Inputs: Trained model, current data.
- Outputs: Cash demand predictions for each branch.
- Processes:
- Feed current data (e.g., today's transactions) into the trained model.
- Generate predictions for cash demand at each branch for the next day.
- Calculate confidence intervals or error bars around the predictions.
Visualization Level 2 DFD:
Data Preparation:
- Inputs: Cash demand predictions, branch information.
- Outputs: Data formatted for visualization.
- Processes:
- Map prediction data to corresponding branches.
- Format data for chosen visualization technique (e.g., chart columns, line graph data points).
Chart Creation:
- Inputs: Formatted data, visualization specifications.
- Outputs: Charts and graphs displaying forecasts.
- Processes:
- Choose chart type (bar chart, line graph, heatmap) based on data and audience.
- Create the chart using a visualization library or software.
- Add labels, titles, and legends for clarity.
Report Generation:
- Inputs: Charts, text summaries, additional information.
- Outputs: Cash forecast reports for users.
- Processes:
- Combine charts, text summaries, and relevant details into a report.
- Format the report for professional presentation.
- Export the report as a PDF or document file.

6. Explain Change Management. What are different change management tactics that are to be applied during the execution of change management?
Answer:
Change management is the process of guiding organizational change to fruition, from the earliest stages of conception and preparation, through implementation and, finally, to resolution. Change management encompasses various strategies, techniques, and tactics to effectively manage organizational change.
The three organizational change tactics to be applied during the execution of change management are mentioned as follows:
- Developmental: Developmental change is gradual improvement in the existing situation of an organization. Organizations generally grow and expand after having experiences and enhanced skills.
- Transitional: It is about replacing existing systems, processes, and strategies with new ones. Traditional change is more challenging to implement because it creates discomfort for employees. It is risky as well as no one can be certain about the outcome of the transition. Therefore, a well-thought-out change management strategy should be in place to execute this kind of change.
- Transformational: Transformational change is about a complete change in the identity of an organization. It is about the emergence of a completely new structure, culture, and reputation. It is a kind of new life for an organization. Transformational change is highly unpredictable as leaders have less control over managing it. It has its path, time, and shape. Therefore, it is the most difficult type of change to manage.
7. Prepare a brief note on 'cloud computing' with clear statements on the associated
technologies, their types, and various issues.
Answer:
Cloud computing is the delivery of different services through the Internet, including data storage, servers, databases, networking, and software. Cloud computing is named as such because the information being accessed is found remotely in the cloud or a virtual space. This technology has revolutionized the way businesses and individuals store, manage, and access data and applications.
Cloud computing is not a single piece of technology like a microchip or a cellphone. Rather, it's a system primarily comprising three services: software-as-a-service (SaaS), infrastructure-as-a-service (IaaS), and platform-as-a-service (PaaS).
- Software-as-a-service (SaaS) involves the licensing of a software application to customers. Licenses are typically provided through a pay-as-you-go model or on-demand. This type of system can be found in Microsoft Office 365.
- Infrastructure-as-a-service (IaaS) involves a method for delivering everything from operating systems to servers and storage through IP-based connectivity as part of an on-demand service. Clients can avoid the need to purchase software or servers and instead procure these resources in an outsourced, on-demand service. Popular examples of the IaaS system include IBM Cloud and Microsoft Azure.
- Platform-as-a-service (PaaS) is considered the most complex of the three layers of cloud-based computing. PaaS shares some similarities with SaaS, the primary difference being that instead of delivering software online, it is a platform for creating software that is delivered via the Internet. This model includes platforms like Salesforce.com and Heroku.
Types of Cloud Computing:
- Public Cloud: Services are hosted and managed by third-party providers and accessible to multiple users over the Internet. Examples include Amazon Web Services (AWS), Microsoft Azure, and Google Cloud Platform (GCP).
- Private Cloud: Services are dedicated to a single organization and hosted either on-premises or by a third-party provider. Private clouds offer greater control, security, and customization.
- Hybrid Cloud: Combines public and private cloud environments, allowing organizations to leverage the scalability and cost-effectiveness of public cloud services while maintaining sensitive data and applications on a private cloud.
8. Discuss about Tactical operational Information Systems and Strategic.
The tactical IS plan outlines the specific strategies and timelines for achieving the organization's goals. It is executed by middle managers who are tasked with acquiring and allocating resources for projects according to the tactical plans, typically spanning one or two years. Tactical IS planning involves assessing the current and anticipated information requirements of the organization, prioritizing IS development projects, and devising allocation plans for financial and technological resources. This process ensures that the organization's information systems are effectively aligned with its operational needs and strategic objectives, enabling efficient utilization of resources to drive progress and innovation.
The operational plan serves as the blueprint for a specific component within the organization, detailing the actions it will undertake to bolster the strategic objectives set by upper management. Operational IS planning, in turn, focuses on crafting detailed plans, including annual operating budgets and individual IS project plans, to support these operational goals. Typically overseen by supervisors of smaller work units, this planning process involves the meticulous coordination of short-term budgets and schedules, spanning periods ranging from a week to six months. Through operational IS planning, organizations ensure the efficient allocation of resources and the effective execution of day-to-day activities, thus contributing to the realization of broader strategic aims and fostering operational excellence at every level.
The strategic plan articulates the organization's objectives, starting with its mission and extending to its envisioned position over the next three, five, or ten years. Provided by top-level managers, it serves as a blueprint for subsequent planning efforts throughout the organization. Strategic Information Systems (IS) play a crucial role in this process, enabling companies to adapt their business strategies swiftly and gain a competitive edge. These systems facilitate rapid responses to environmental shifts, fostering the production of high-quality products at low costs. IS at the strategic level leverages IT to develop products, services, and capabilities that confer significant advantages in the global marketplace. Top-level managers, CEOs, presidents, general managers, corporate boards, steering committees, and boards of directors are among those responsible for overseeing and implementing these strategic initiatives.
9. Write short notes on the following:
a) Big-data processing using Hadoop system
Computing technology has changed the way we work, study, and live. The distributed data processing technology is one of the popular topics in the IT field. It provides a simple and centralized computing platform by reducing the cost of the hardware. The characteristics of distributed data processing technology have changed the whole industry. Hadoop, as the open source project of Apache foundation, is the most representative platform of distributed big data processing. Hadoop is the open-source implementation of MapReduce and is widely used for big data processing. This software is even available through some Cloud providers such as Amazon EMR [96] to create Hadoop clusters to process big data using Amazon EC2 resources.. Hadoop adopts the HDFS file system. By using this file system, data will be located close to the processing node to minimize the communication overhead.
Hadoop has several key features that make it well-suited for big data processing:
- Distributed Storage: Hadoop stores large data sets across multiple machines, allowing for the storage and processing of extremely large amounts of data.
- Scalability: Hadoop can scale from a single server to thousands of machines, making it easy to add more capacity as needed.
- Fault-Tolerance: Hadoop is designed to be highly fault-tolerant, meaning it can continue to operate even in the presence of hardware failures.
- Data locality: Hadoop provides data locality feature, where the data is stored on the same node where it will be processed, this feature helps to reduce the network traffic and improve the performance
- High Availability: Hadoop provides high Availability feature, which helps to make sure that the data is always available and is not lost.
- Flexible Data Processing: Hadoop’s MapReduce programming model allows for the processing of data in a distributed fashion, making it easy to implement a wide variety of data processing tasks.
- Data Integrity: Hadoop provides built-in checksum feature, which helps to ensure that the data stored is consistent and correct.
- Data Replication: Hadoop provides data replication feature, which helps to replicate the data across the cluster for fault tolerance.
- Data Compression: Hadoop provides built-in data compression feature, which helps to reduce the storage space and improve the performance.
- YARN: A resource management platform that allows multiple data processing engines like real-time streaming, batch processing, and interactive SQL, to run and process data stored in HDFS.
b) Collective intelligence through social-network
Collective intelligence is a sociological concept that describes how a group intellect begins to form when people work together. By interacting and even competing with one another, the group shares information and collectively solves problems, giving them a greater chance to find answers than they would have on their own. The reason this works is because the crowd achieves wisdom by finding a consensus in correct answers and dismissing or discarding incorrect or deviant ideas.
Collective intelligence can be harnessed from social media through a variety of means and can be beneficial to your organization. Surveys and polls are available on sites like Facebook and LinkedIn, allowing you to identify trends and patterns in people’s opinions. By monitoring the Likes, shares, and comments on social networking sites, you will eventually see certain patterns arise in people’s viewpoints that show the popularity of one opinion over another. To give an example, let’s say that you owned a shoe company and wanted to identify which product line would sell the most. By uploading photos to a social bookmarking site like Pinterest (www.pinterest.com), people can click a link indicating they like the product or pin (i.e., repost) photos they like to their page called a pinboard. These photos can be shared with others on other social networking sites like Facebook, increasing exposure to the product. By monitoring the reactions of people, you’ll see trends where a majority of people liked one shoe over another, and thereby predict that it will sell better than others. While the results might not have a guarantee, they would tend to be more accurate than the opinion of a single or small group of decision-makers.
c) Link analysis as web structure mining
Web mining is the Data Mining technique that automatically discovers or extracts the information from web documents. It is the extraction of interesting and potentially useful patterns and implicit information from artifacts or activity related to the World Wide Web.
Web structure mining uses link analysis algorithms to analyze the structure of the web. It considers the web as a graph and uses link analysis techniques to link different types of web pages. These techniques consider factors such as relative importance and similarity to the user query.
Web structure mining focuses on link analysis and navigation. It helps identify patterns in how users navigate through the website.
Link analysis is one of the most effective methods of web structure mining. However, traditional link analysis methods only consider the flat structure of the web with hyperlinks. This may affect the precision of the analysis result.
Web mining techniques provide additional information through hyperlinks where different documents are connected. We can view the web as a directed labeled graph whose nodes are the documents or pages and edges are the hyperlinks between them . This directed graph structure is known as a web graph. There are a number of algorithms proposed based on link analysis such as PageRank, Weighted PageRank, and HITS.
PageRank This algorithm was developed by Brin and Page at Stanford University which extends the idea of citation analysis. In citation analysis the incoming links are treated as citations but this technique could not provide fruitful results because this gives some approximation of the importance of the page. So PageRank provides a better approach that can compute the importance of a web page by simply counting the number of pages that are linking to it. These links are called backlinks. If a backlink comes from an important page then this link is given higher weightage than those which are coming from unimportant pages. The link from one page to another is considered as a vote. Not only the number of votes that a page receives is important but the importance of pages that cast the vote is also important. Page and Brin proposed a formula to calculate the PageRank of a page A as stated below:
PR(A)= (1-d)+d(PR(T1)/C(T1)+…..+PR(Tn/C(Tn)) .....(1) Here PR(Ti) is the PageRank of the Pages To which links to page A, C(Ti) is the number of outlinks on page Ti and d is the damping factor. It is used to stop other pages having too much influence. The PageRank forms a probability distribution over the web pages so the sum of PageRanks of all web pages will be one. The PageRank of a page can be calculated without knowing the final value of the PageRank of other pages. It is an iterative algorithm that follows the principle of the normalized link matrix of the web. PageRank of a page depends on the number of pages pointing to a page.
d) Critical success factors of IS
Critical Success Factors (also known as Key Results Areas or KRAs) are the areas of your business or project that are vital to its success.
Identifying and communicating CSFs within your organization is essential to ensure that your business or project stays focused on what needs to be done to achieve success. It can also help you to avoid wasting effort and resources on less important areas of the business.
The Four Main Types of Critical Success Factors are as follows:
- Industry factors result from the specific characteristics of your industry. These are the things that you must do to remain competitive within your market. For example, a tech start-up might identify innovation as a CSF.
- Environmental factors result from macro-environmental influences on your organization. For example, the business climate, the economy, your competitors, and technological advancements. A PEST Analysis can help you to understand your environmental factors better.
- Strategic factors result from your organization's specific competitive strategy. They might include the way your organization chooses to position and market itself. For example, whether it's a high-volume, low-cost producer; or a low-volume, high-cost one.
- Temporal factors result from your organization's internal changes and development and are usually short-lived. Specific barriers, challenges, and influences will determine these CSFs. For example, a rapidly expanding business might have a CSF of increasing its international sales.
To identify and develop CSFs for your organization, follow these five steps:
- Research mission, values, and strategy
- Identify strategic objectives and candidate CSFs
- Evaluate and prioritize CSFs
- Communicate CSFs to key stakeholders
- Monitor and measure progress
Submitted By,
Devraj Parajuli (076bei013)
Prakriti Timalsena(076bei024)
Prayag Man Mane(076bei027)
Sanim Kumar Khatri(076bei037)