E-R Diagram
E-R MODEL IN DATABASE
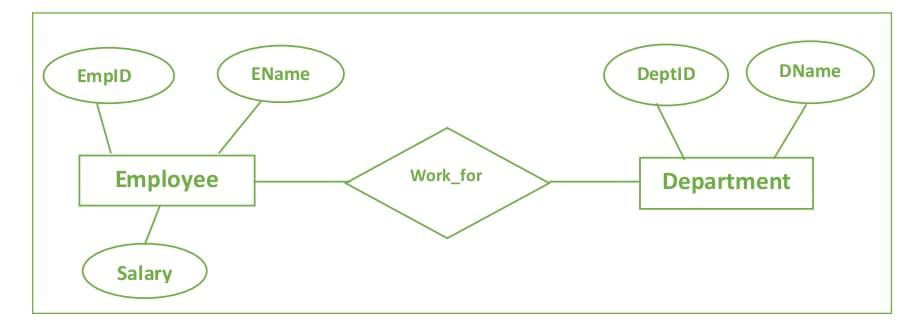
An Entity-Relationship (E-R) diagram is a graphical representation of the entities, attributes, and relationships within a database. It is a visual tool used in database design to model the structure of a database system. E-R diagrams are based on the Entity-Relationship model, which was introduced by Peter Chen in the 1970s. The main components of an E-R diagram include entities, attributes, relationships, and cardinality.
Components of an E-R diagram:
Entity:
An entity represents a real-world object or concept, such as a person, place, thing, or event. In the diagram, entities are typically represented as rectangles.
Example: "Student," "Course," and "Department" can be entities.
Attribute:
An attribute is a property or characteristic of an entity. It describes some aspect of the entity.
Attributes are represented inside the rectangle representing the entity.
Example: Attributes of the "Student" entity might include "StudentID," "Name," and "Date_of_Birth."
Relationship:
A relationship represents an association between two or more entities. It describes how entities are connected or interact with each other.
Relationships are represented by lines connecting the related entities. The lines often have labels that describe the nature of the relationship.
Example: A "Takes" relationship between "Student" and "Course" entities might represent the fact that a student takes a particular course.
Cardinality:
Cardinality describes the number of instances of one entity that can be associated with a single instance of another entity. It is expressed as a ratio, such as one-to-one (1:1), one-to-many (1:N), or many-to-many (M:N).
Cardinality notation is often shown near the ends of the relationship lines.
Example: A one-to-many relationship between "Department" and "Course" might indicate that a department can offer multiple courses, but a course is offered by only one department.